Paid growth / Developer tools

A marketing site that finally moved the same numbers the product does.

Good product, flat acquisition, a bounce rate that tracked load time. We rebuilt the site, then ran ads with creative from the same room that wrote the headlines.

3.1xBlended ROAS
-41%Cost per acquisition
98Lighthouse mobile
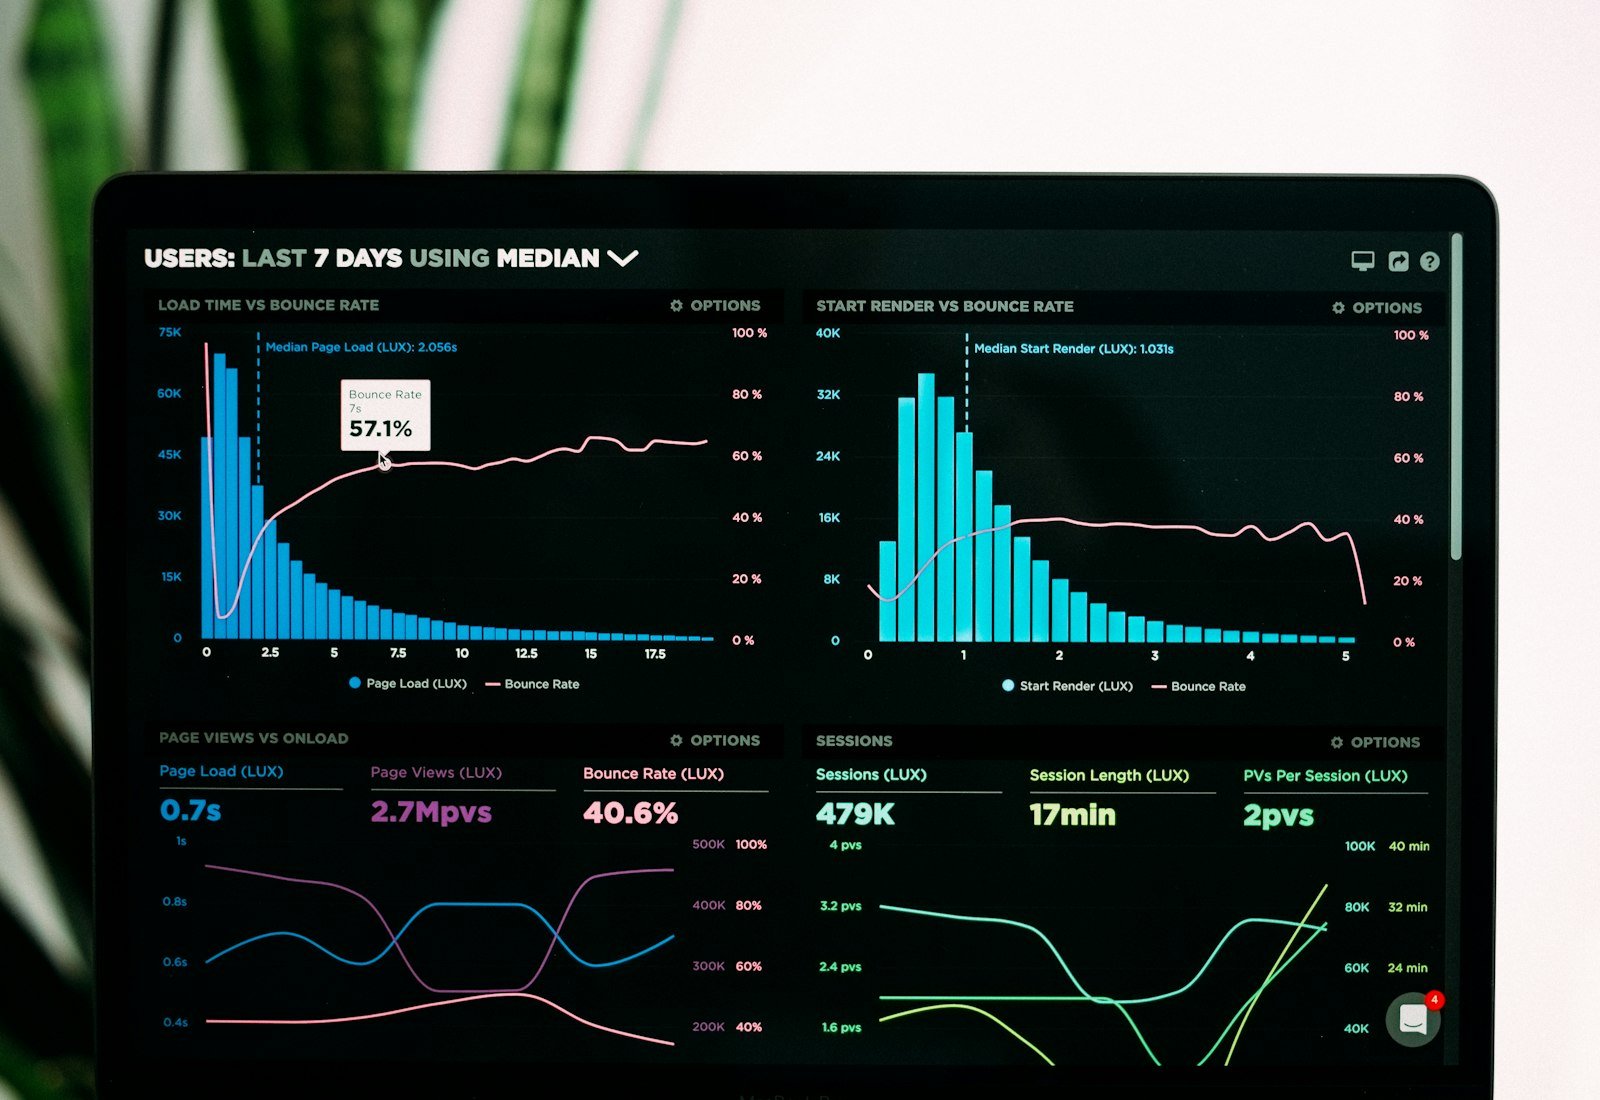
Laptop dashboard showing load time versus bounce rate and session metrics
The chart that started the brief: bounce climbing with every extra second. Photo: Unsplash / open license.
The brief

What they hired us to fix.

A developer-tools company whose docs were better than their homepage. Paid was leaking because the landing page took 3.8 seconds on a mid-range Android and the creative was made by a different agency than the site.

What shipped

The actual work.

  • Rewritten homepage and pricing, aimed at the person who already knows they need the tool.
  • Next.js rebuild, 98 Lighthouse on mobile, LCP under 1.4 seconds.
  • Paid on Google and Meta, creative produced in the same sprint as the pages.
  • Seven-day test cycle: one landing change, two ads, one readout.
  • A dashboard the founder actually opened, not a 40-slide monthly PDF.
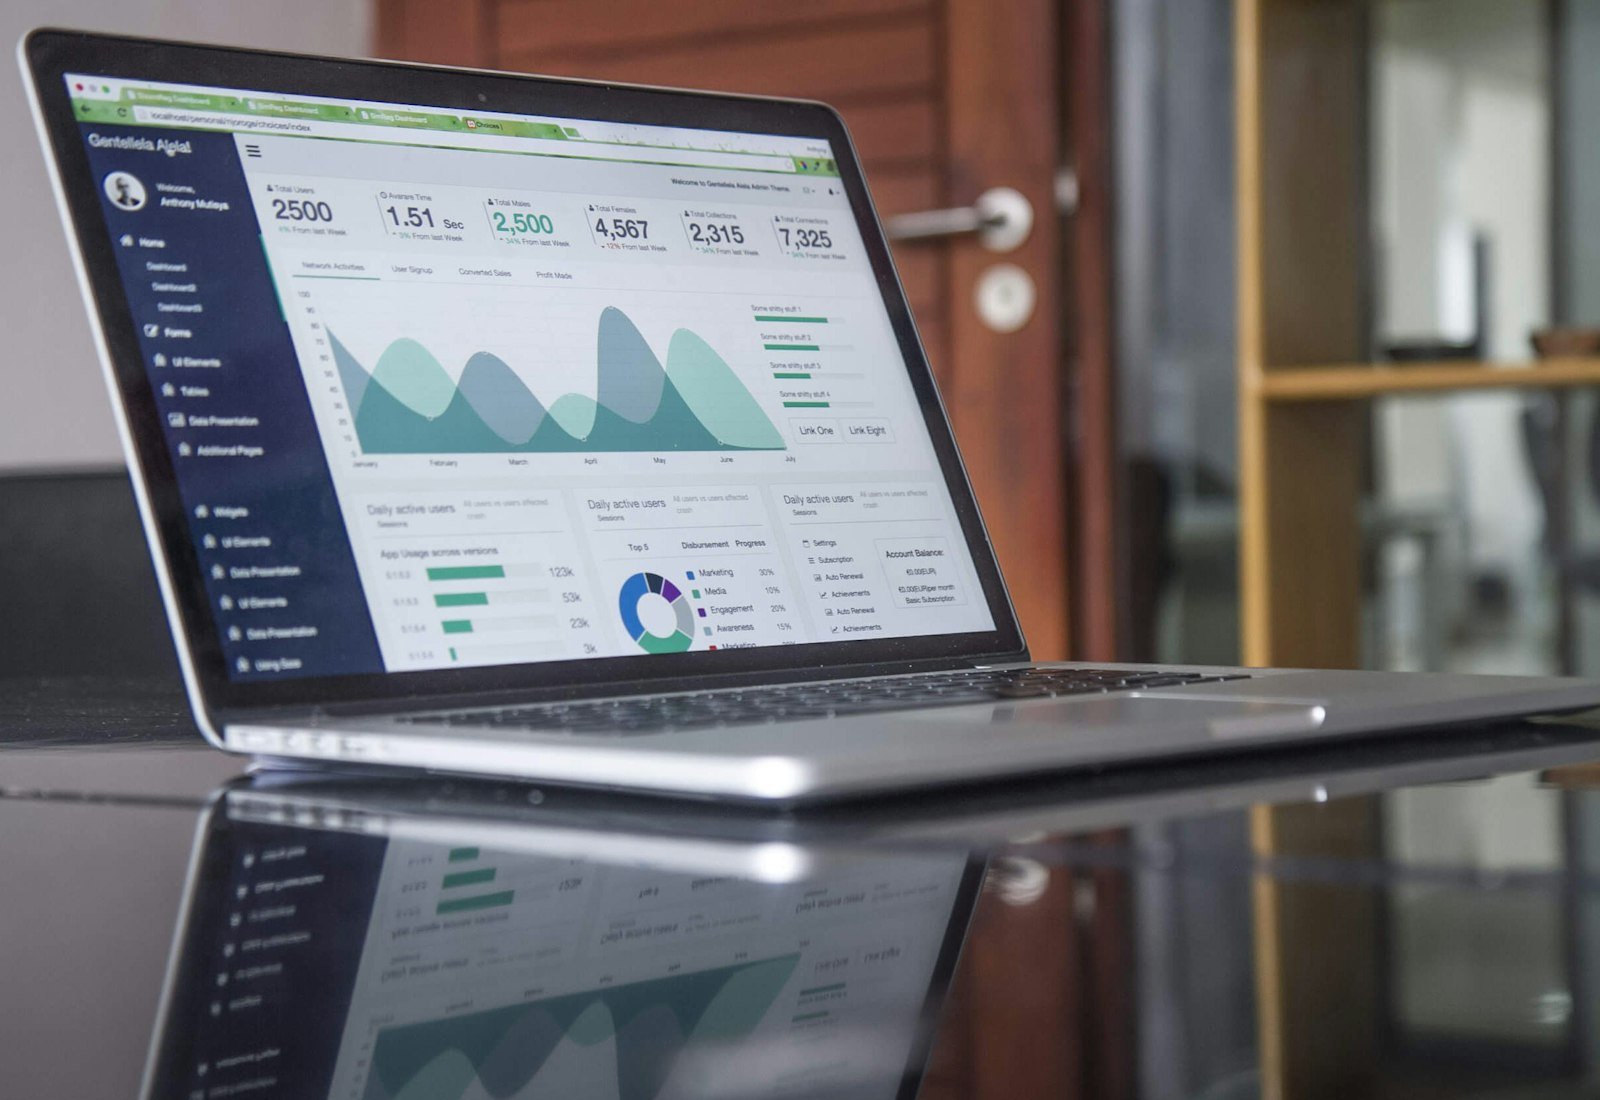
Laptop on a glass desk showing a product analytics dashboard
The weekly review view. Creative, site and paid in one meeting, not three vendors.
What changed

Acquisition stopped being a shrug.

Blended ROAS hit 3.1x. Cost per acquisition dropped 41%. The test cycle is a week because the people writing the ad also ship the page.

“We used to wait a month to learn something. Now we learn it before the invoice.”

Rafi Stein
Founder, Orbit Labs

Photography on this page is from Unsplash, used under the Unsplash License. The brands and numbers describe studio case studies, not the photographers.